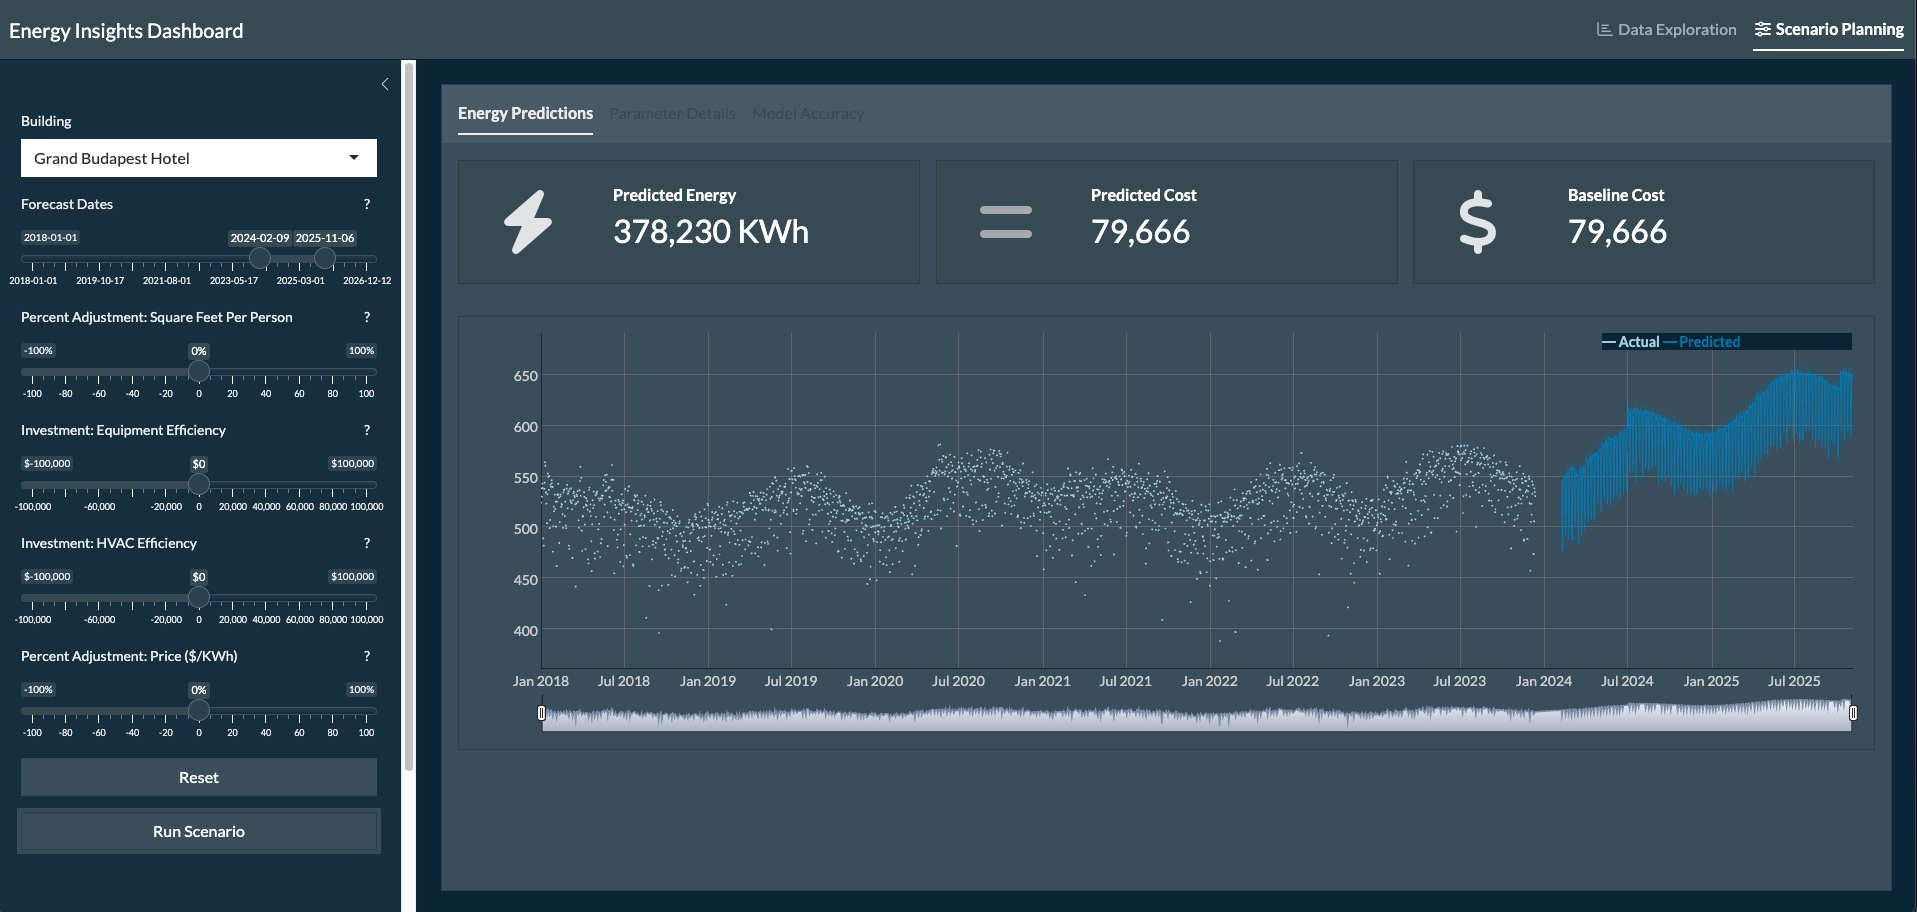
Energy Insights — a building energy use & forecasting app
The Problem
I wanted to demonstrate my ability to build interactive data tools, like an R Shiny app, that let users descriptively explore data, make predictions, and test the impacts of different scenarios.
Approach
Interactive R Shiny app.
Skills
Simulate real-world variability to showcase my ability to reason through complex scenarios.
Build an intuitive, useful app that mixes appealing, modern design with insightful data analytics.
Deploy time-series forecasting and scenario planning tools that display my ability to integrate user inputs into time-series forecasting, unlocking dynamic 'what-if' scenarios in a complex, multivariate context.
Tools
R Studio
R Shiny
Examples / project teasers
Results
The data may be made up, but the skills the app demonstrates are real and can be applied to a variety of domains facing similar hurdles with understanding, forecasting, and communicating their data.

